
Variable Renaming in R
Variable renaming does not have to be a tedious task. In this post, I share several methods for quickly renaming many variables in the R Environment…
Batch Importing Data Files into R
Programming can automate repetitive and tedious tasks. In this post, I share my three preferred methods for batch importing data files into the R environment…

Beyond the Trend: Storytelling with Scatter Plots
Scatter plots are a great starting point for data exploration and discussion. In this post, I share three strategies for taking the humble scatter plot to new heights…
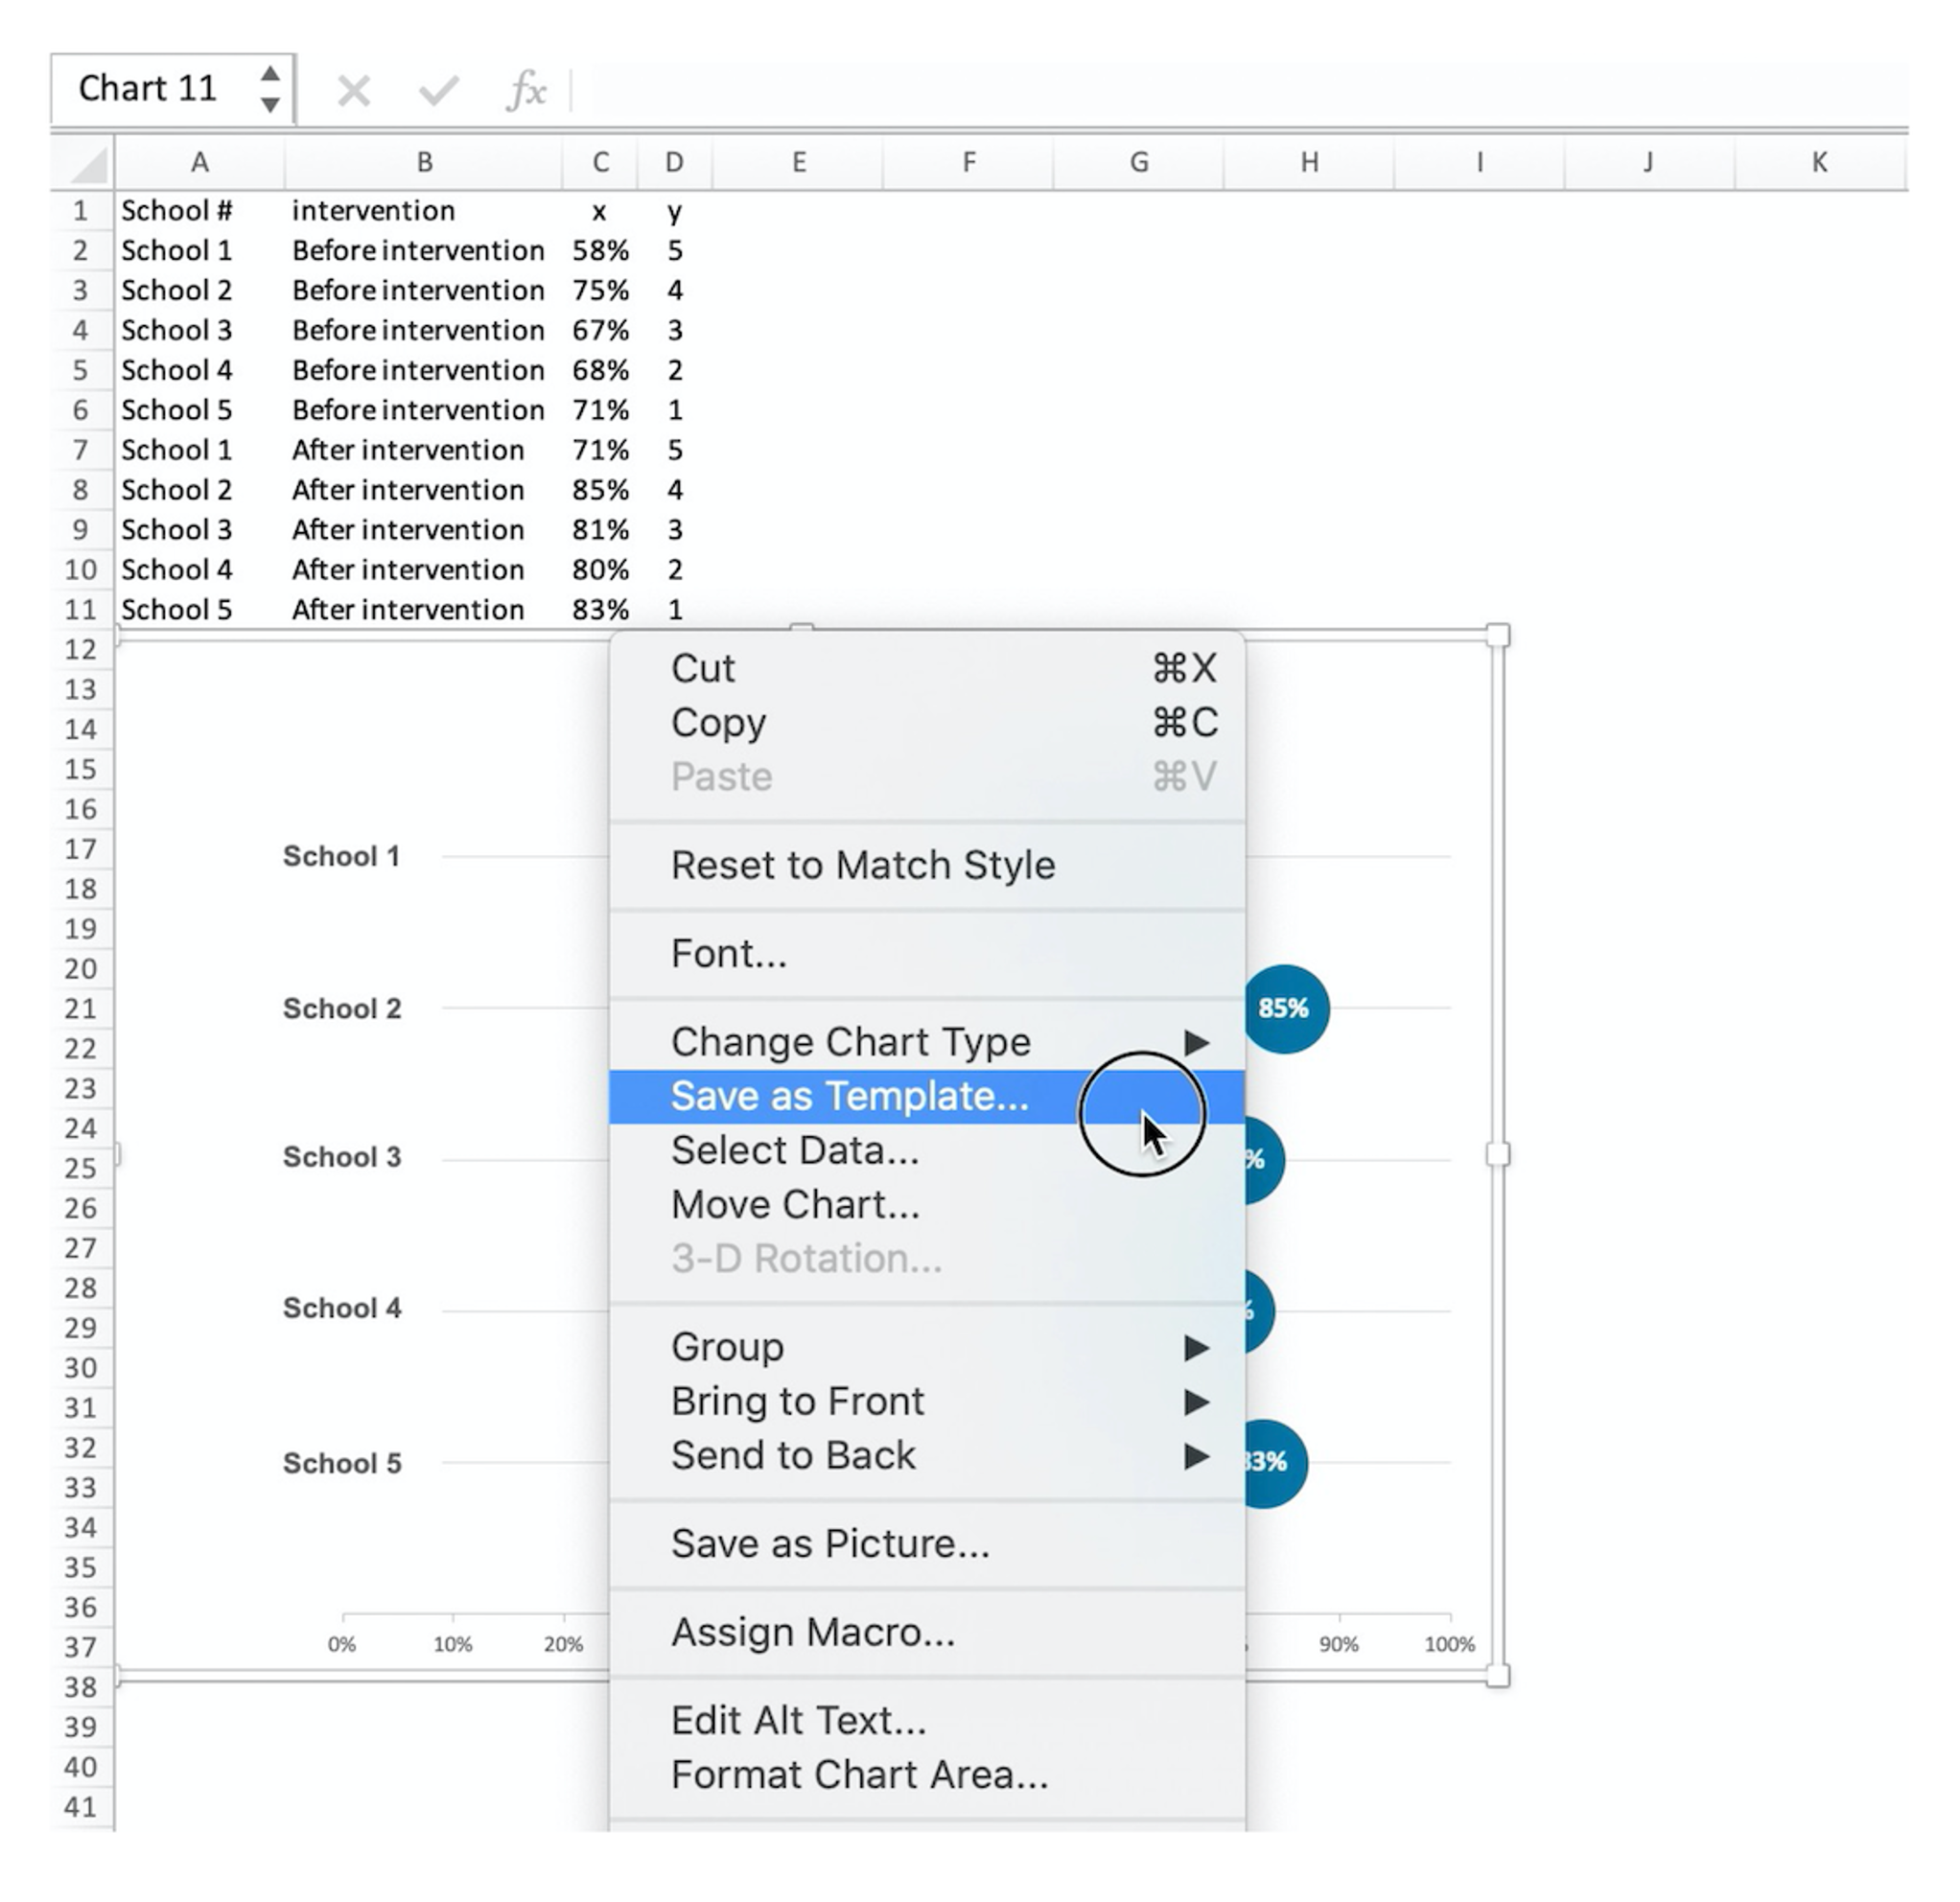
Save Time with (Chart) Templates
If you spend more time creating charts than sharing your data stories, invest in some chart templates…
Effective DataViz: The Ultimate Show and Tell
An effective data visualization is like a great show and tell presentation: a delicate balance between presenting your data and telling a story…
Declutter Your Designs
Data visualization design is about more than presenting a pretty picture; it’s about (visually) communicating information in a clear and compelling way—sans clutter…