
Be Careful With (Data) Binning
Grouping data into bins or categories can make it easier to analyze. But beware, binning can lead to deceptive data (re)presentations…
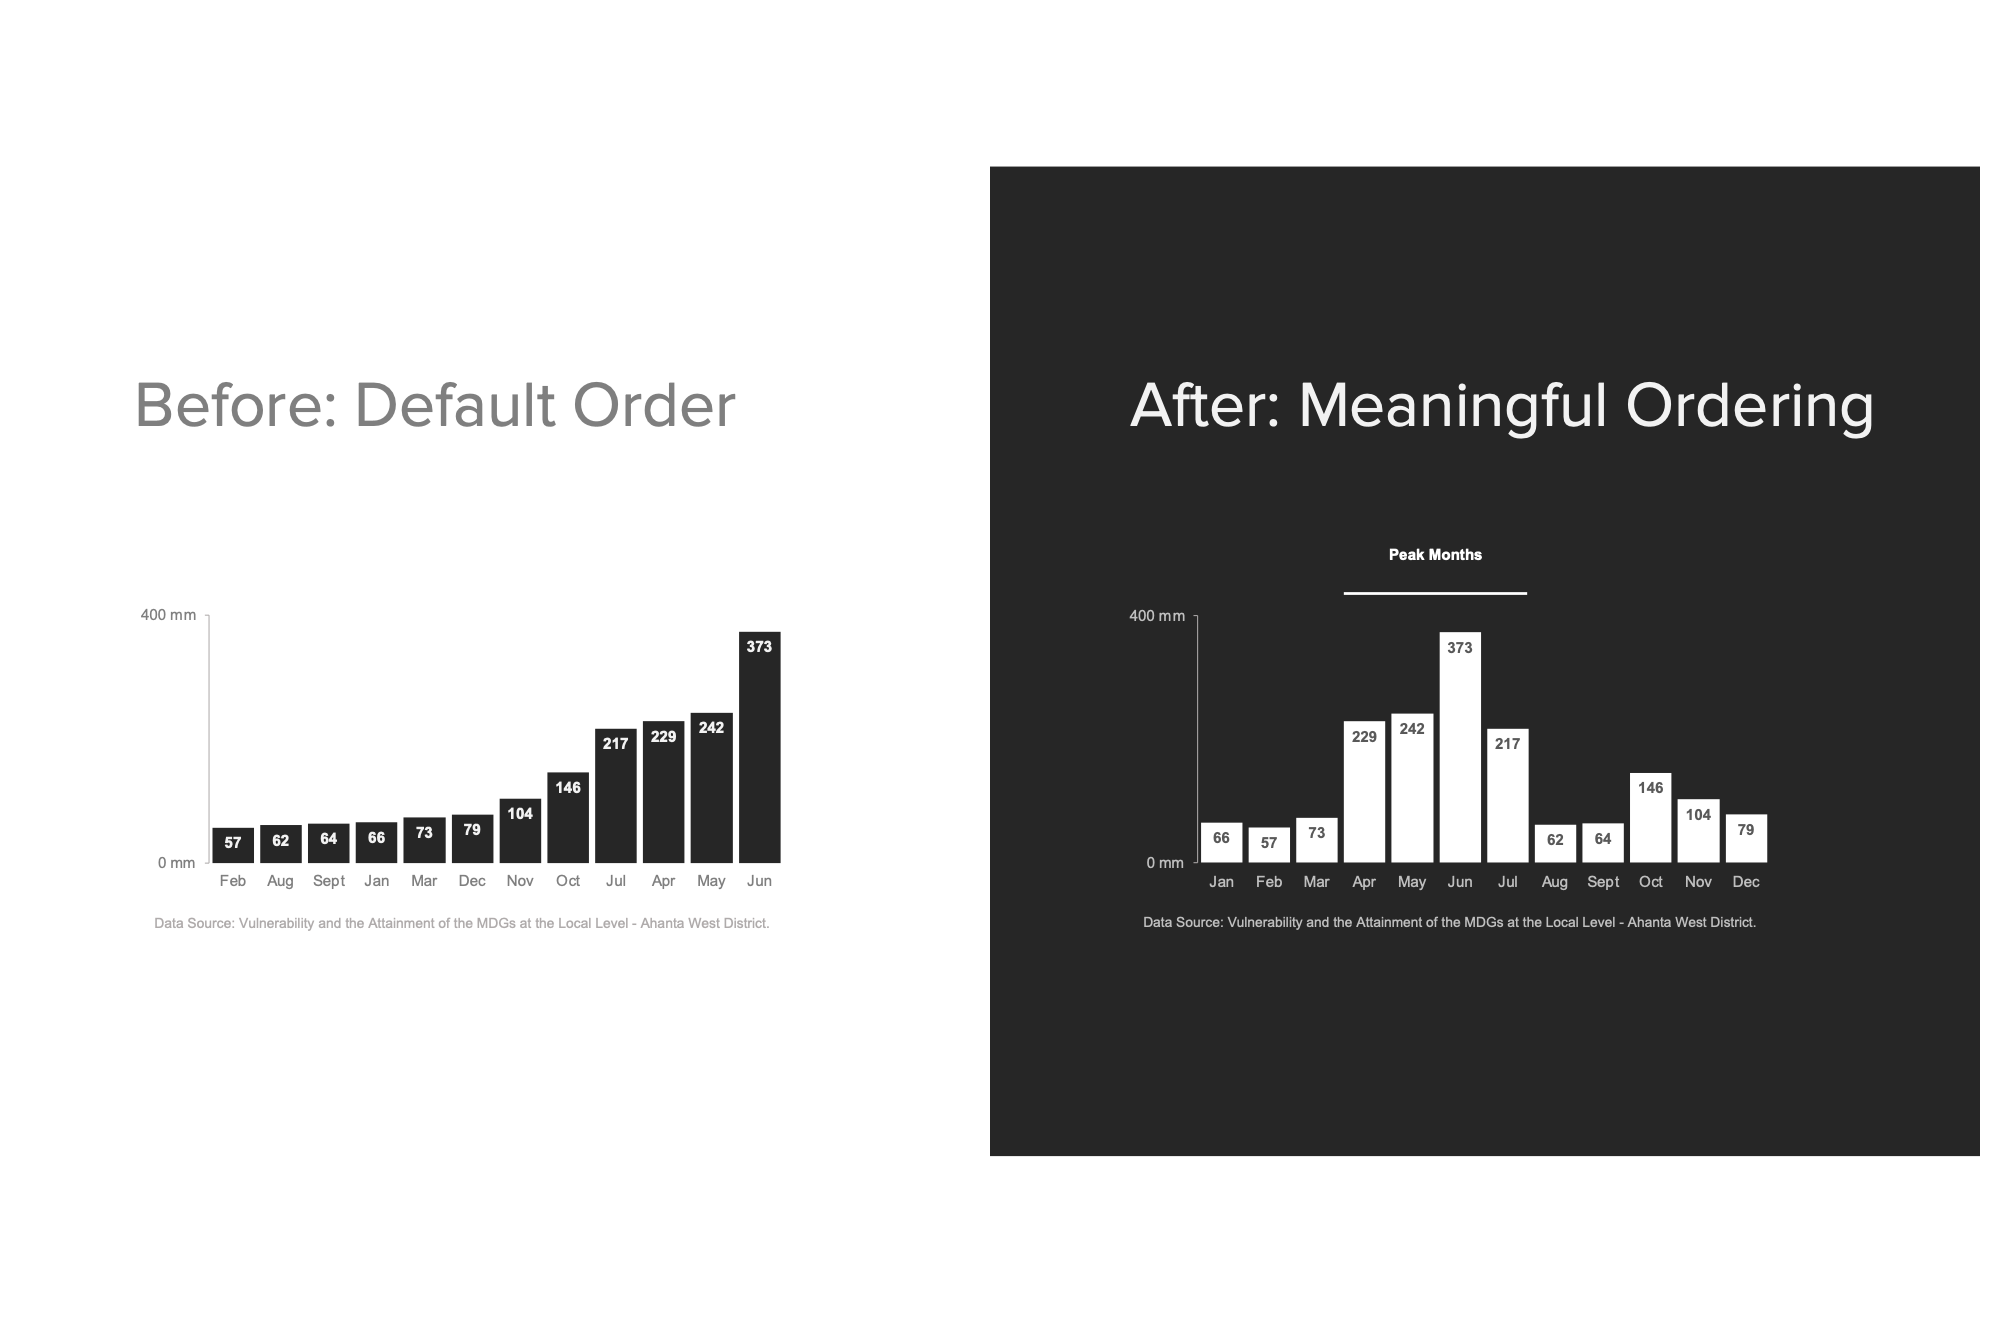
Order Your Data with Intention – Part 3
Displaying data in an order that supports interpretation can help you tell a more compelling story. This post discusses ordering data chronologically…
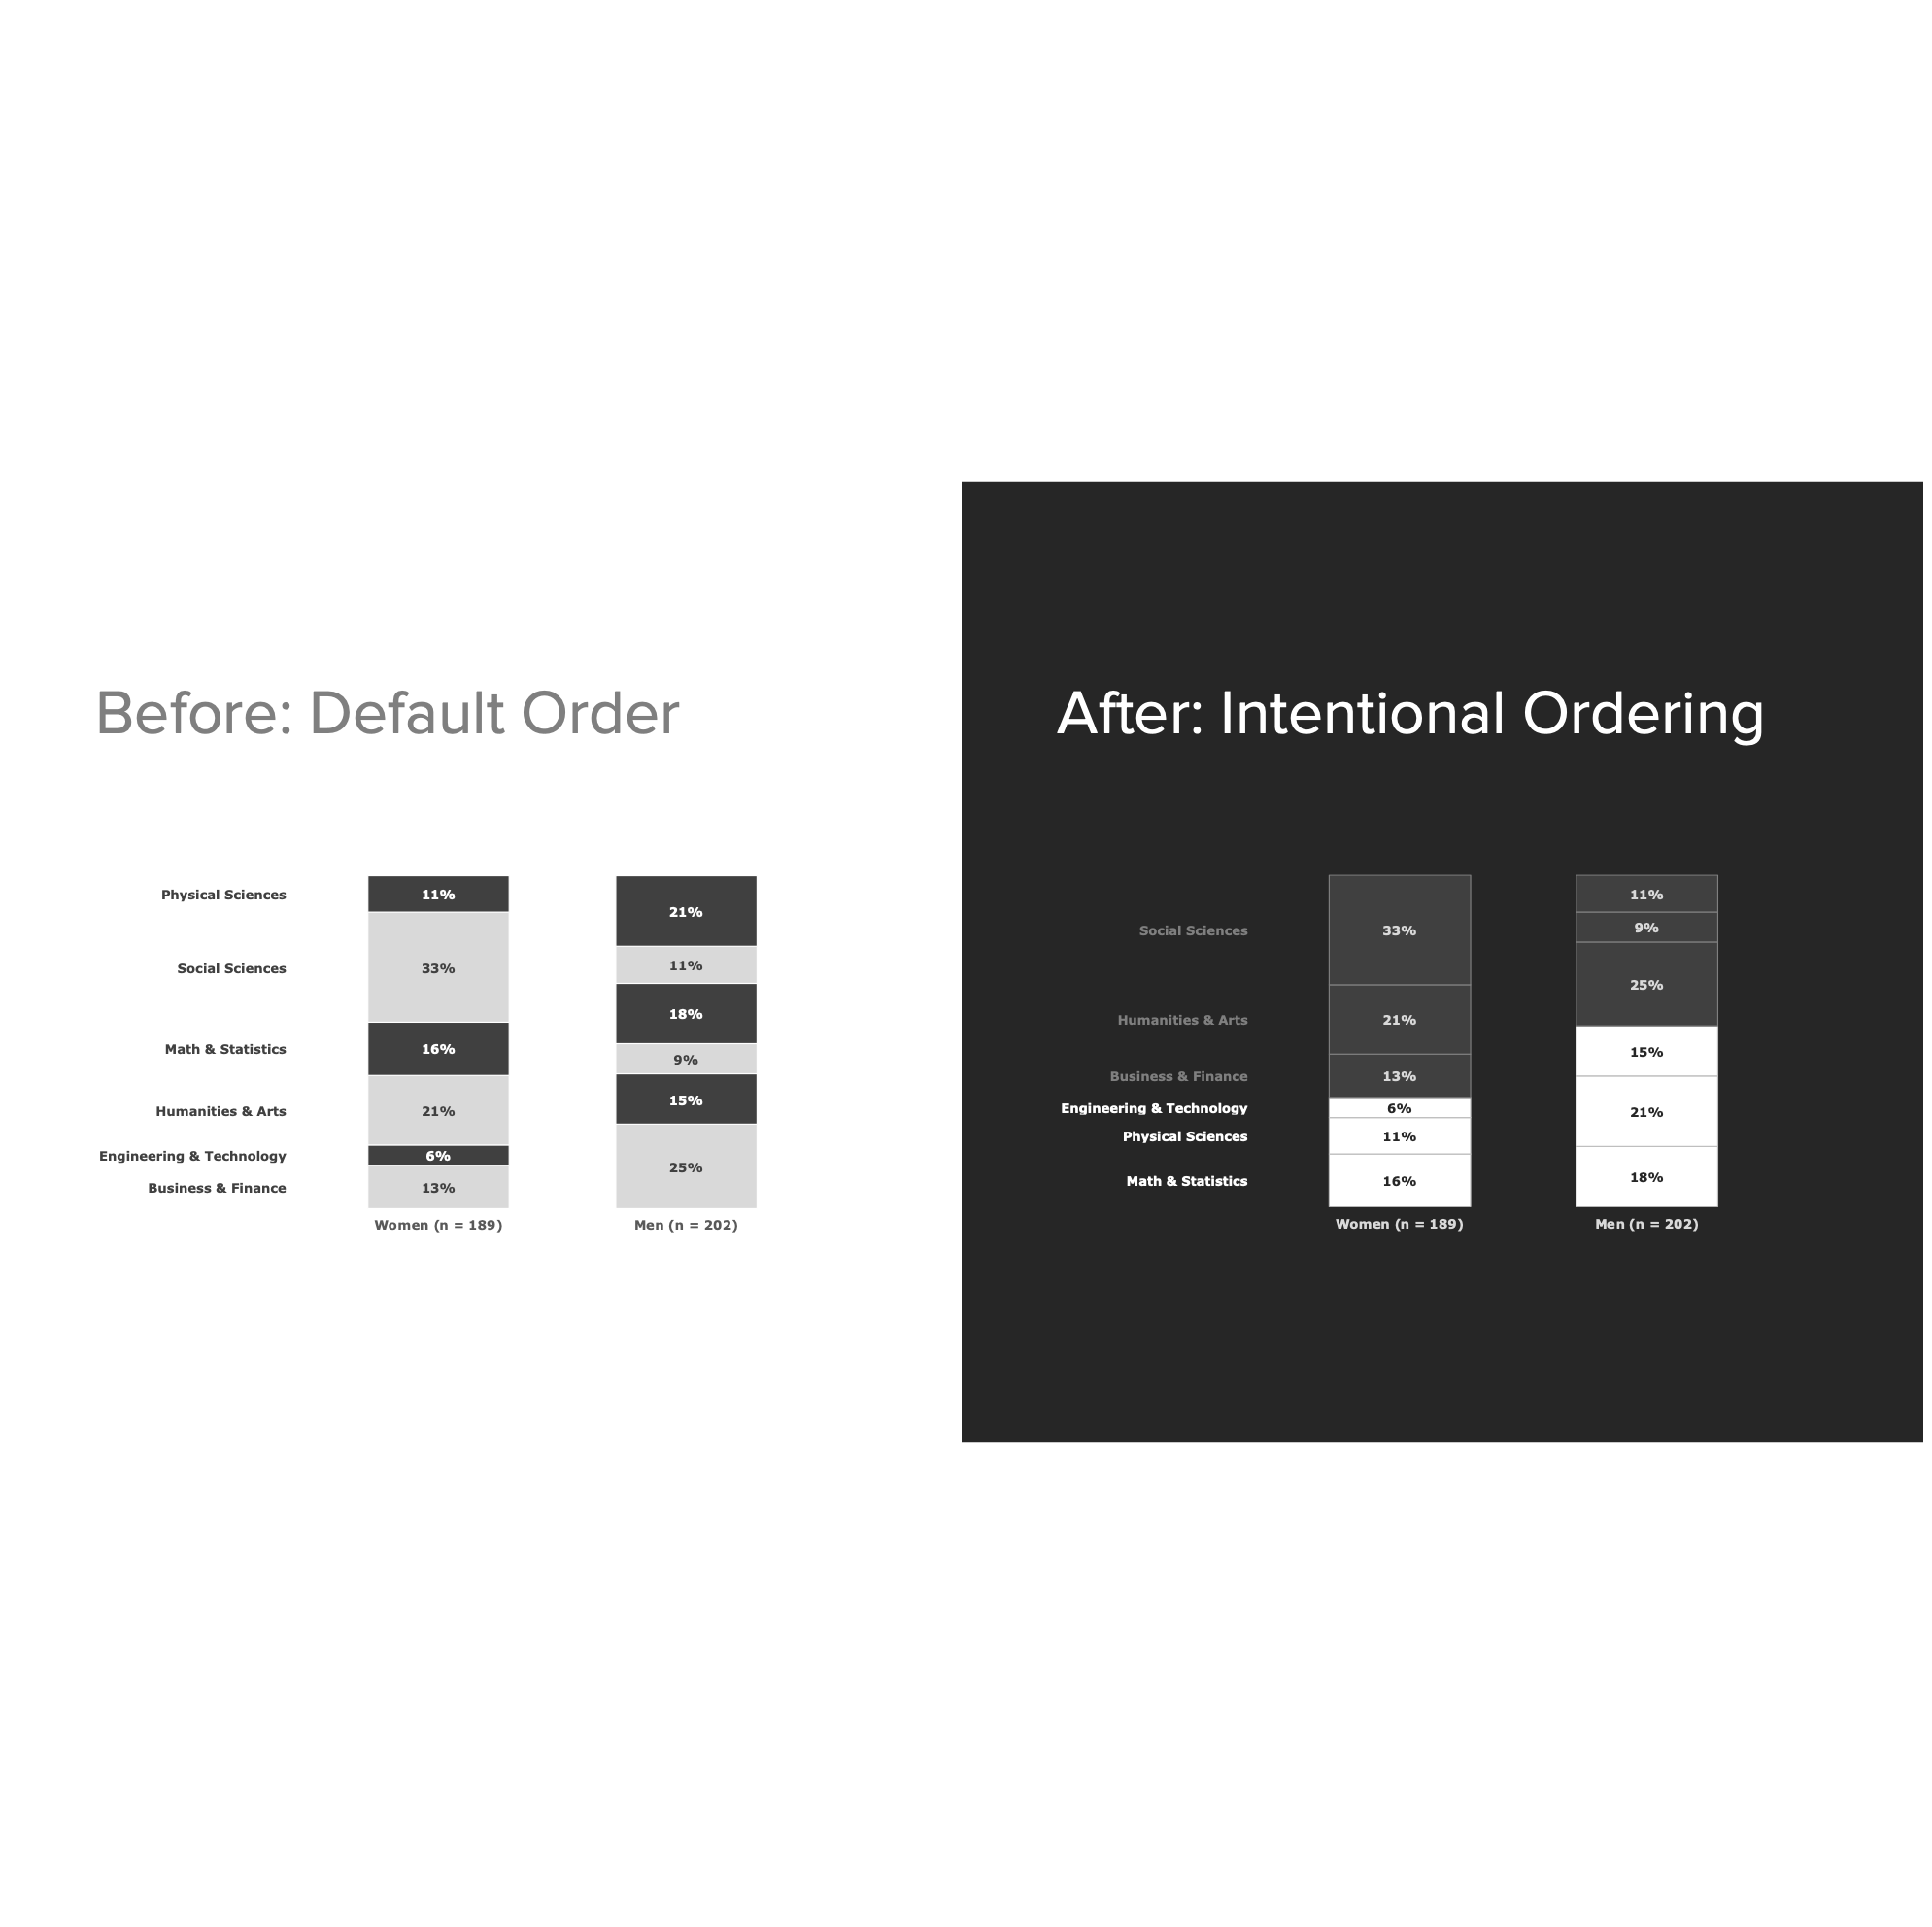
Order Your Data with Intention – Part 2
Displaying data in an order that supports interpretation can help you tell a more compelling story. This post, the second in a series of three, discusses ordering chart series…
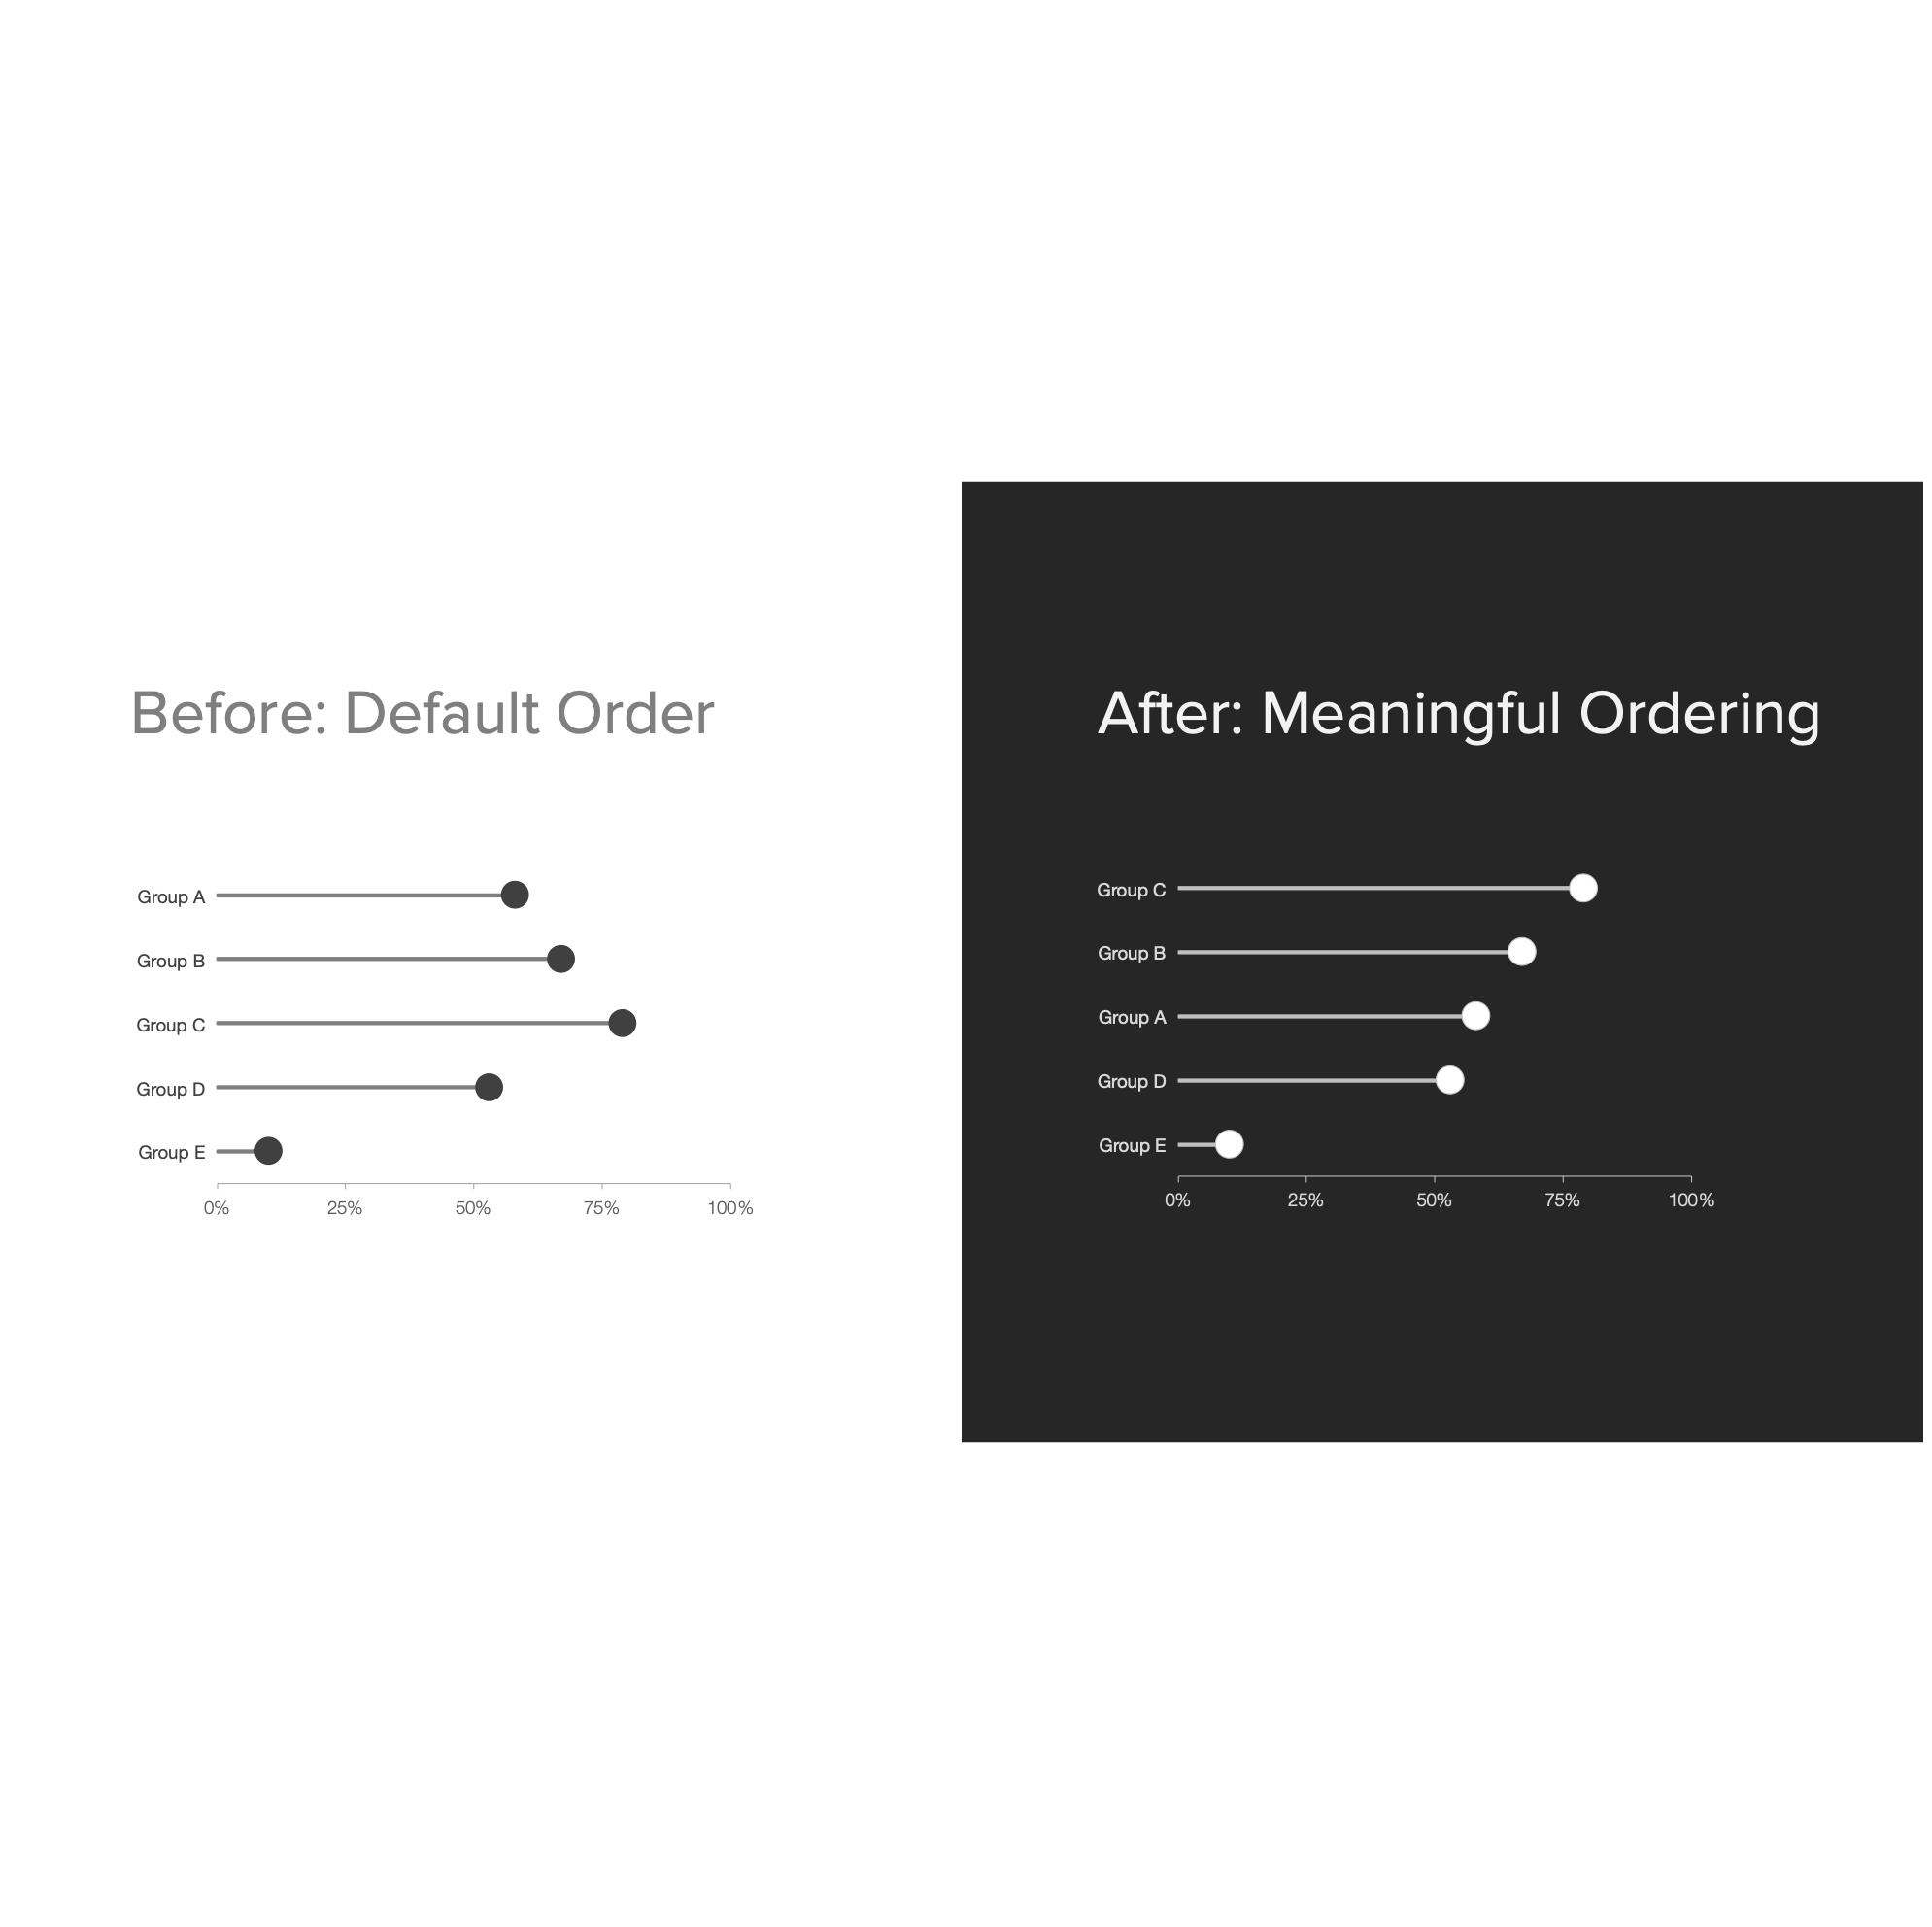
Order Your Data with Intention – Part 1
Displaying data in an order that supports interpretation can help you tell a more compelling story. This post, the first in a series of three, discusses data sorting…

Save Time with ChaRt Templates
Spend less time creating charts and more time sharing your data stories. Learn how to create chart templates in R…
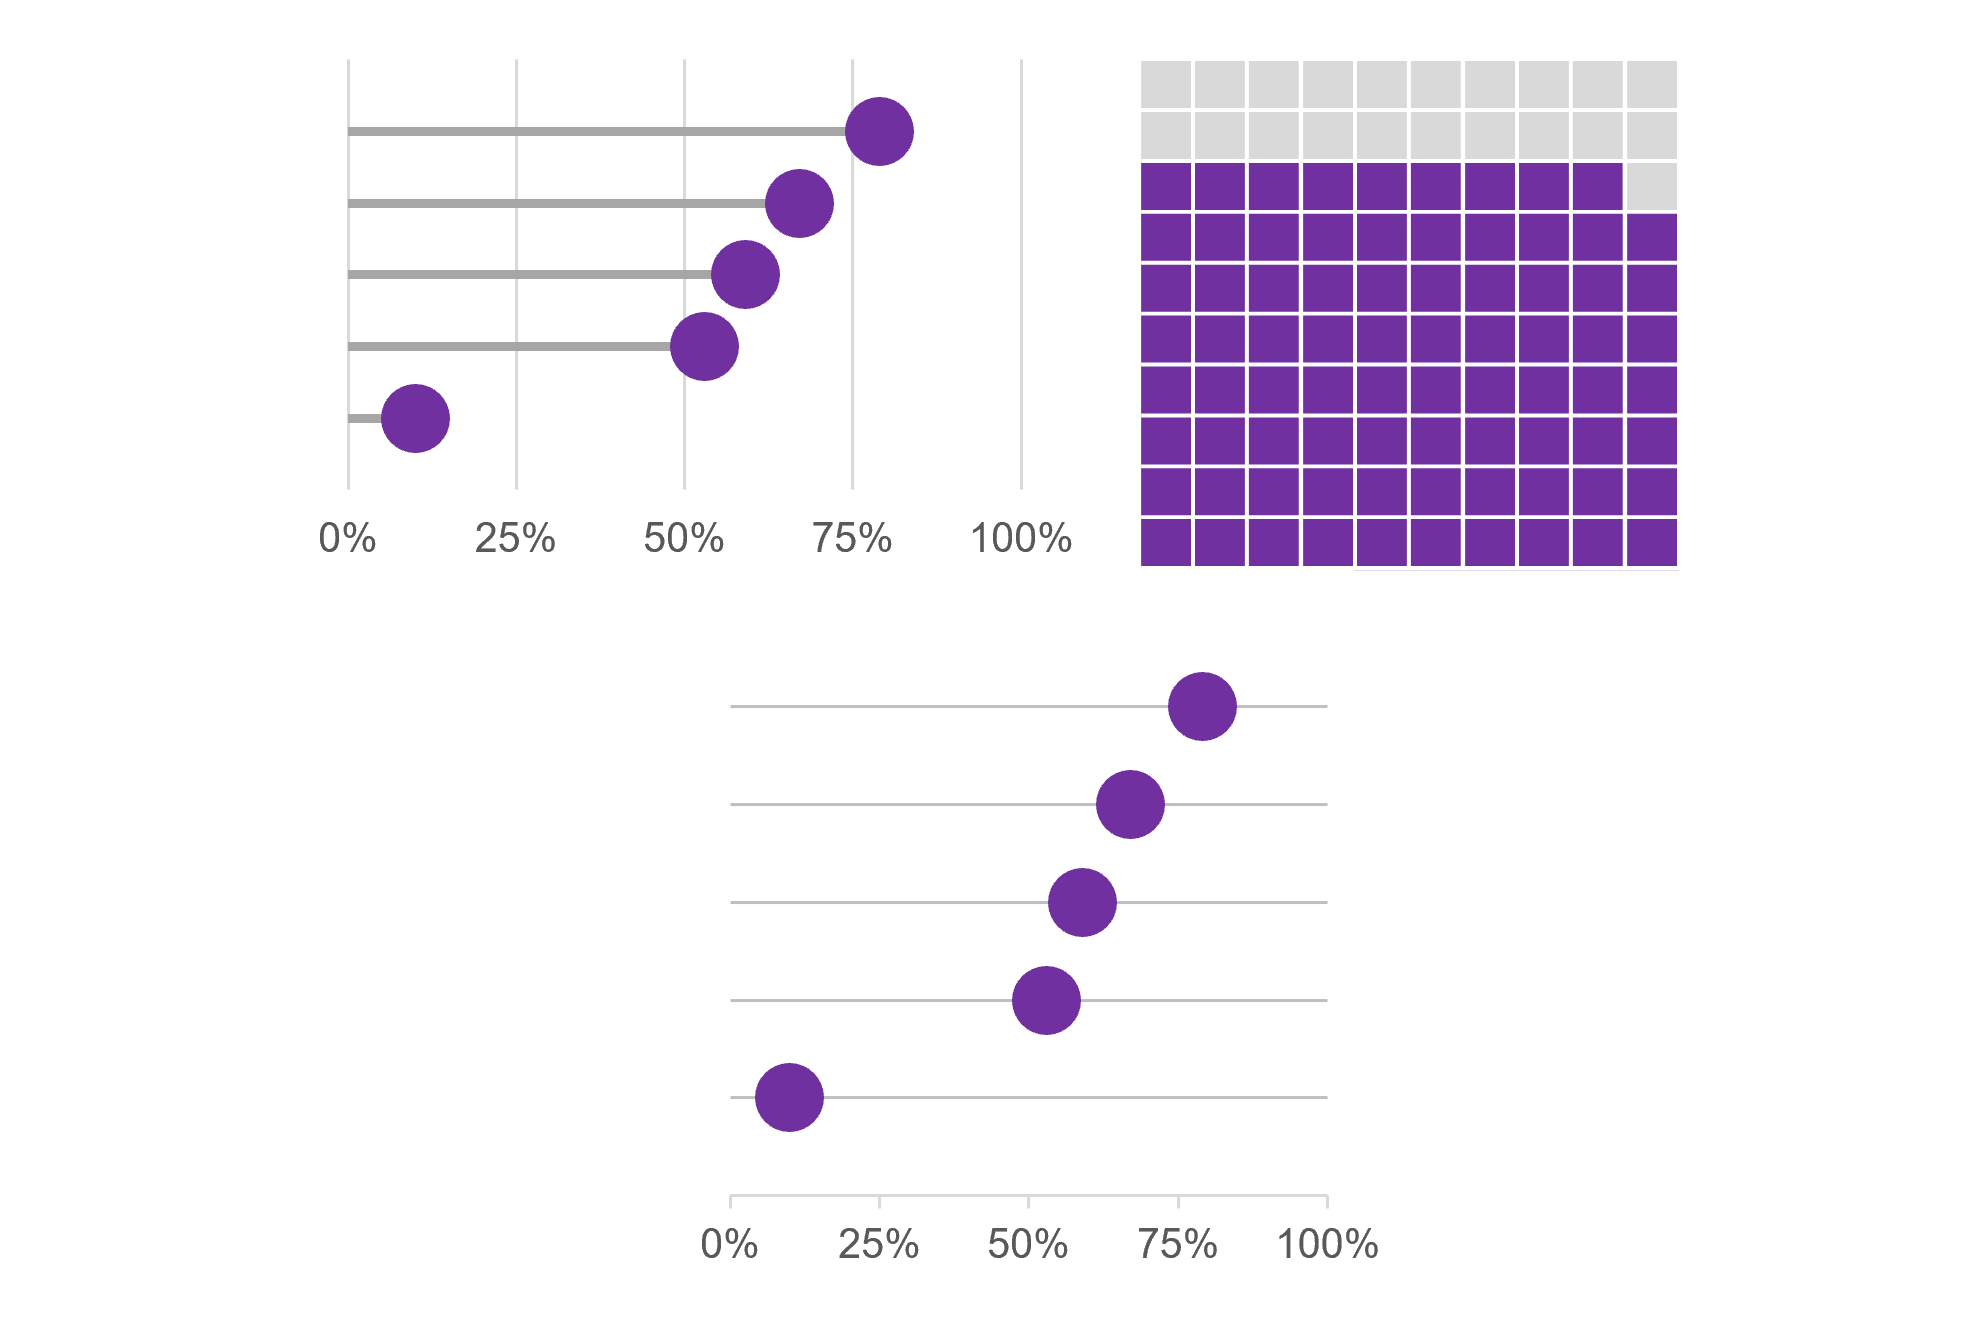
Beyond the Bar Part II: Three Alternatives for Visualizing Comparisons
Using too many bar charts in a visualization makes for a dull display. This post shares three alternatives to the bar chart that pack a powerful punch…