
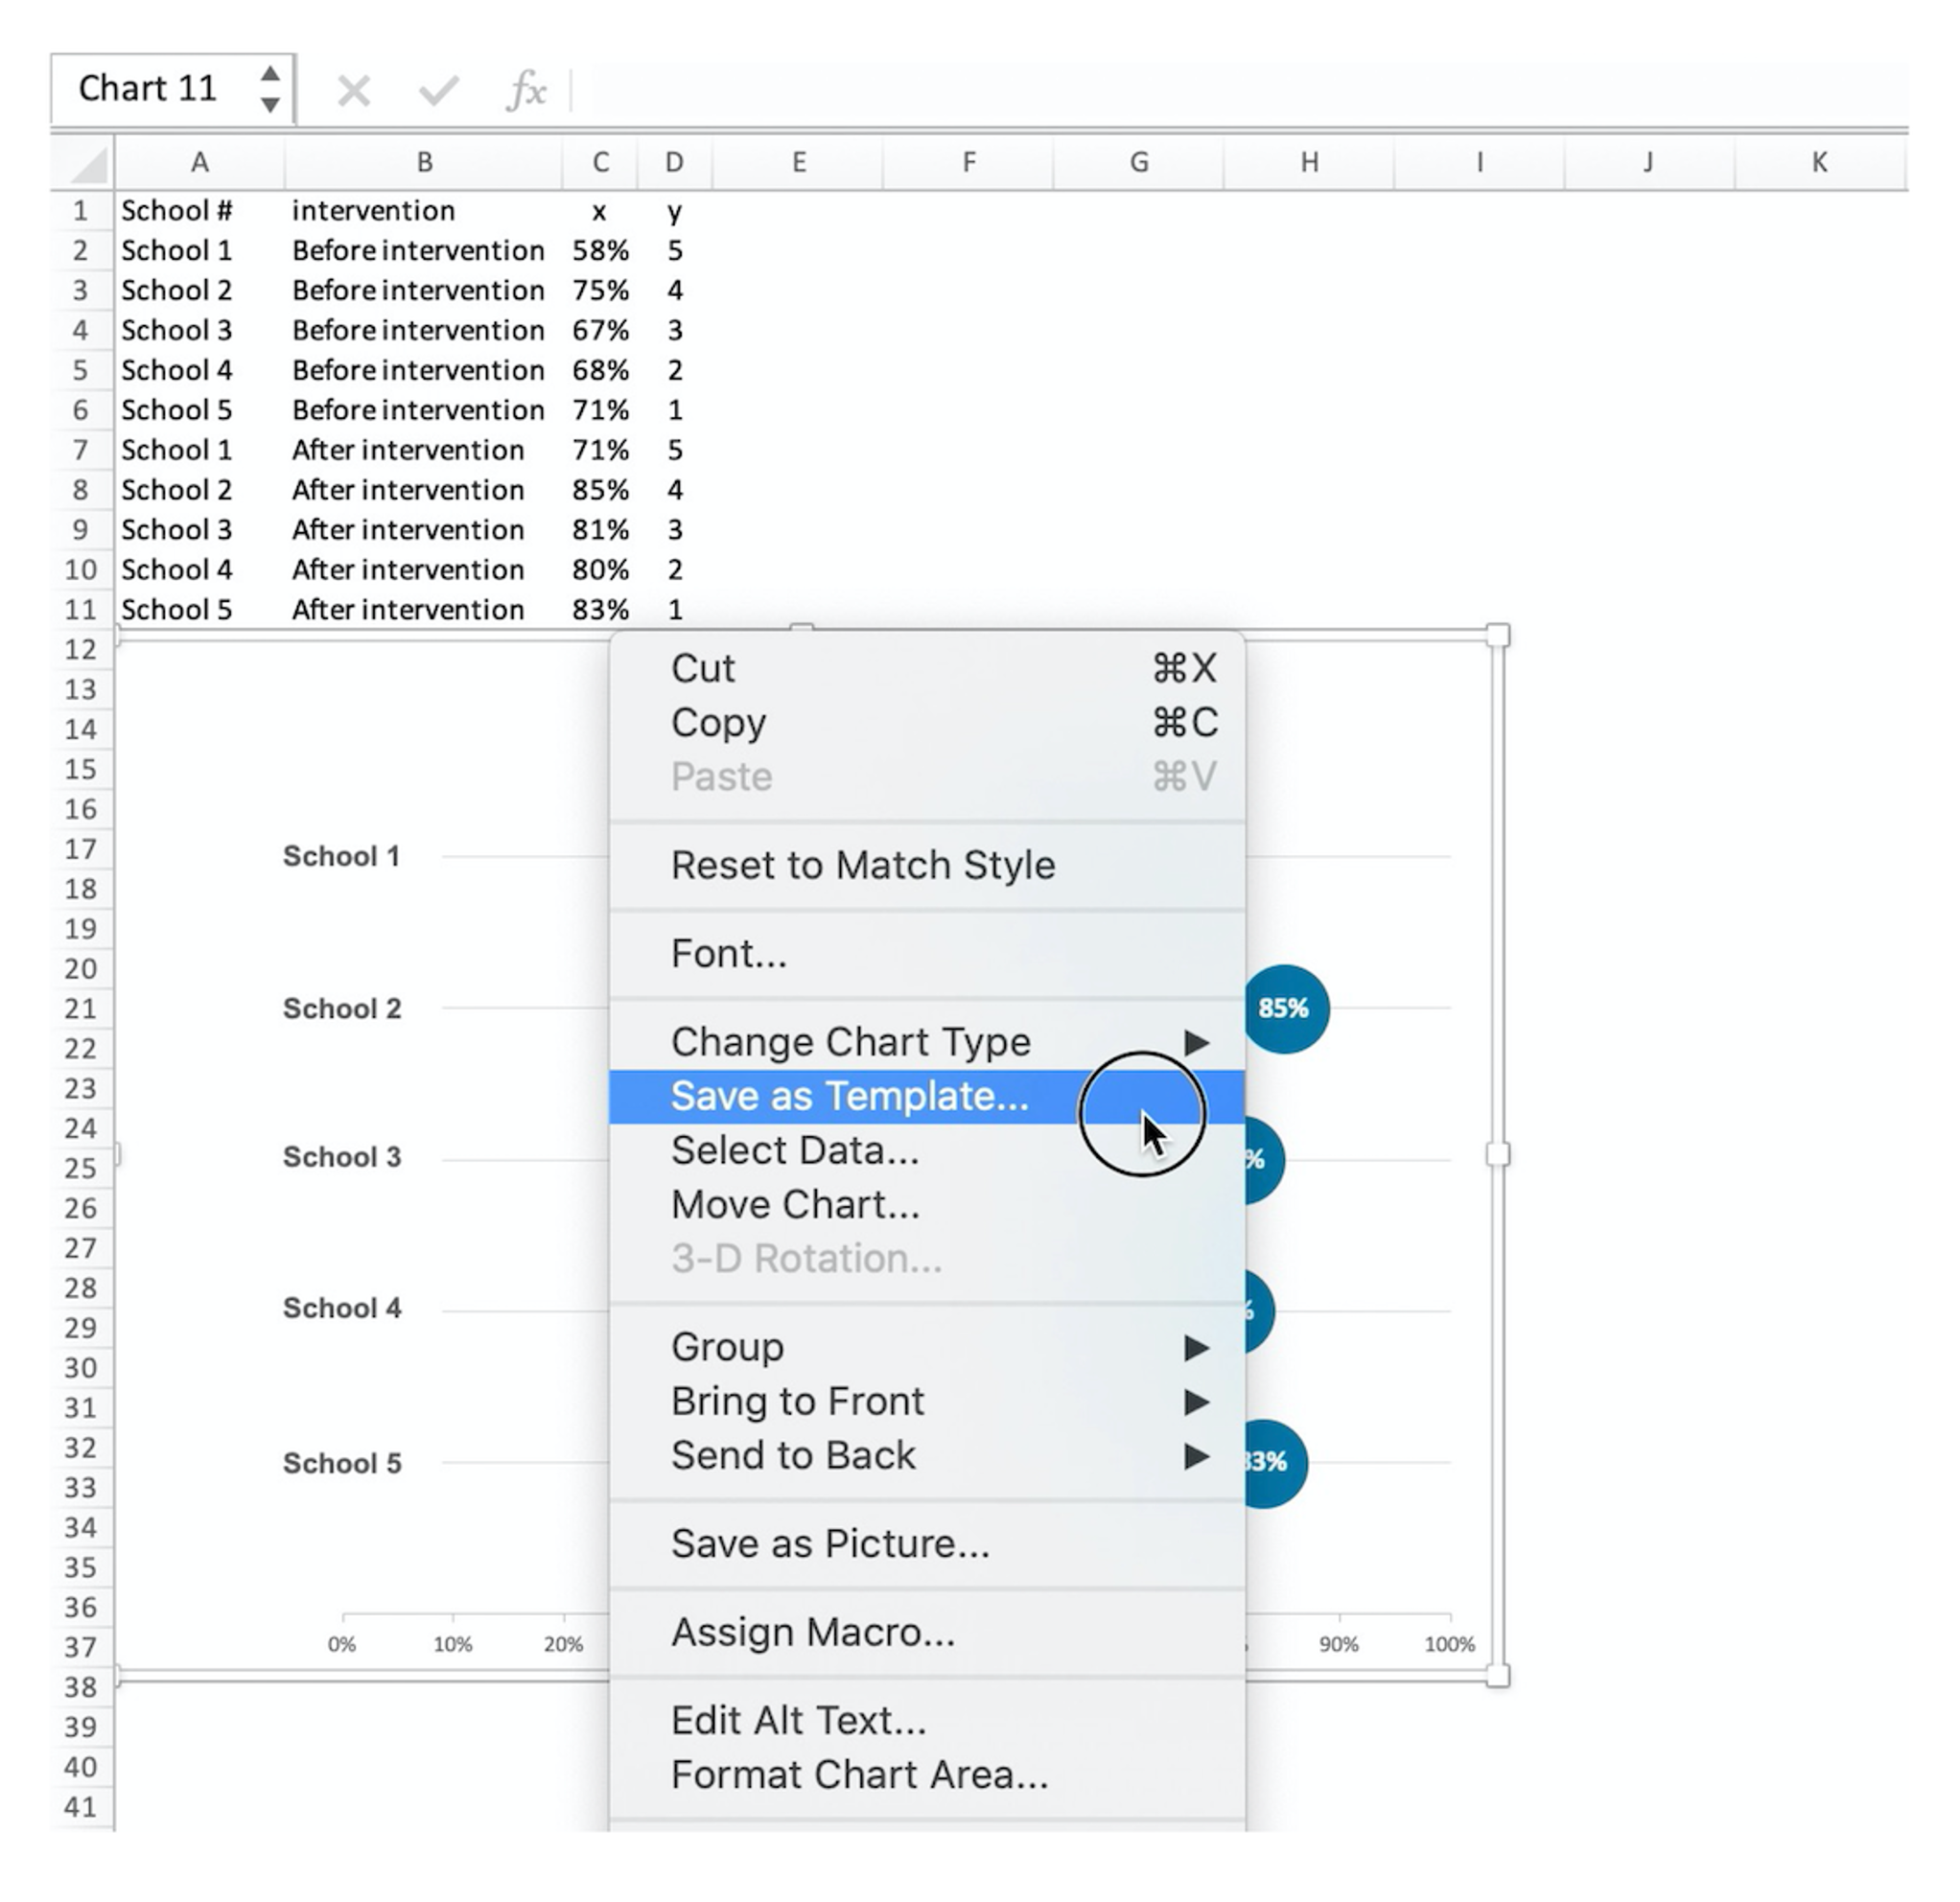
Save Time with (Chart) Templates
If you spend more time creating charts than sharing your data stories, invest in some chart templates…
Effective DataViz: The Ultimate Show and Tell
An effective data visualization is like a great show and tell presentation: a delicate balance between presenting your data and telling a story…
Declutter Your Designs
Data visualization design is about more than presenting a pretty picture; it’s about (visually) communicating information in a clear and compelling way—sans clutter…
Simplify Your Comparisons Using Small Multiples
Visuals with an overwhelming number of categories are confusing to interpret. Simplify the chart into small multiples…
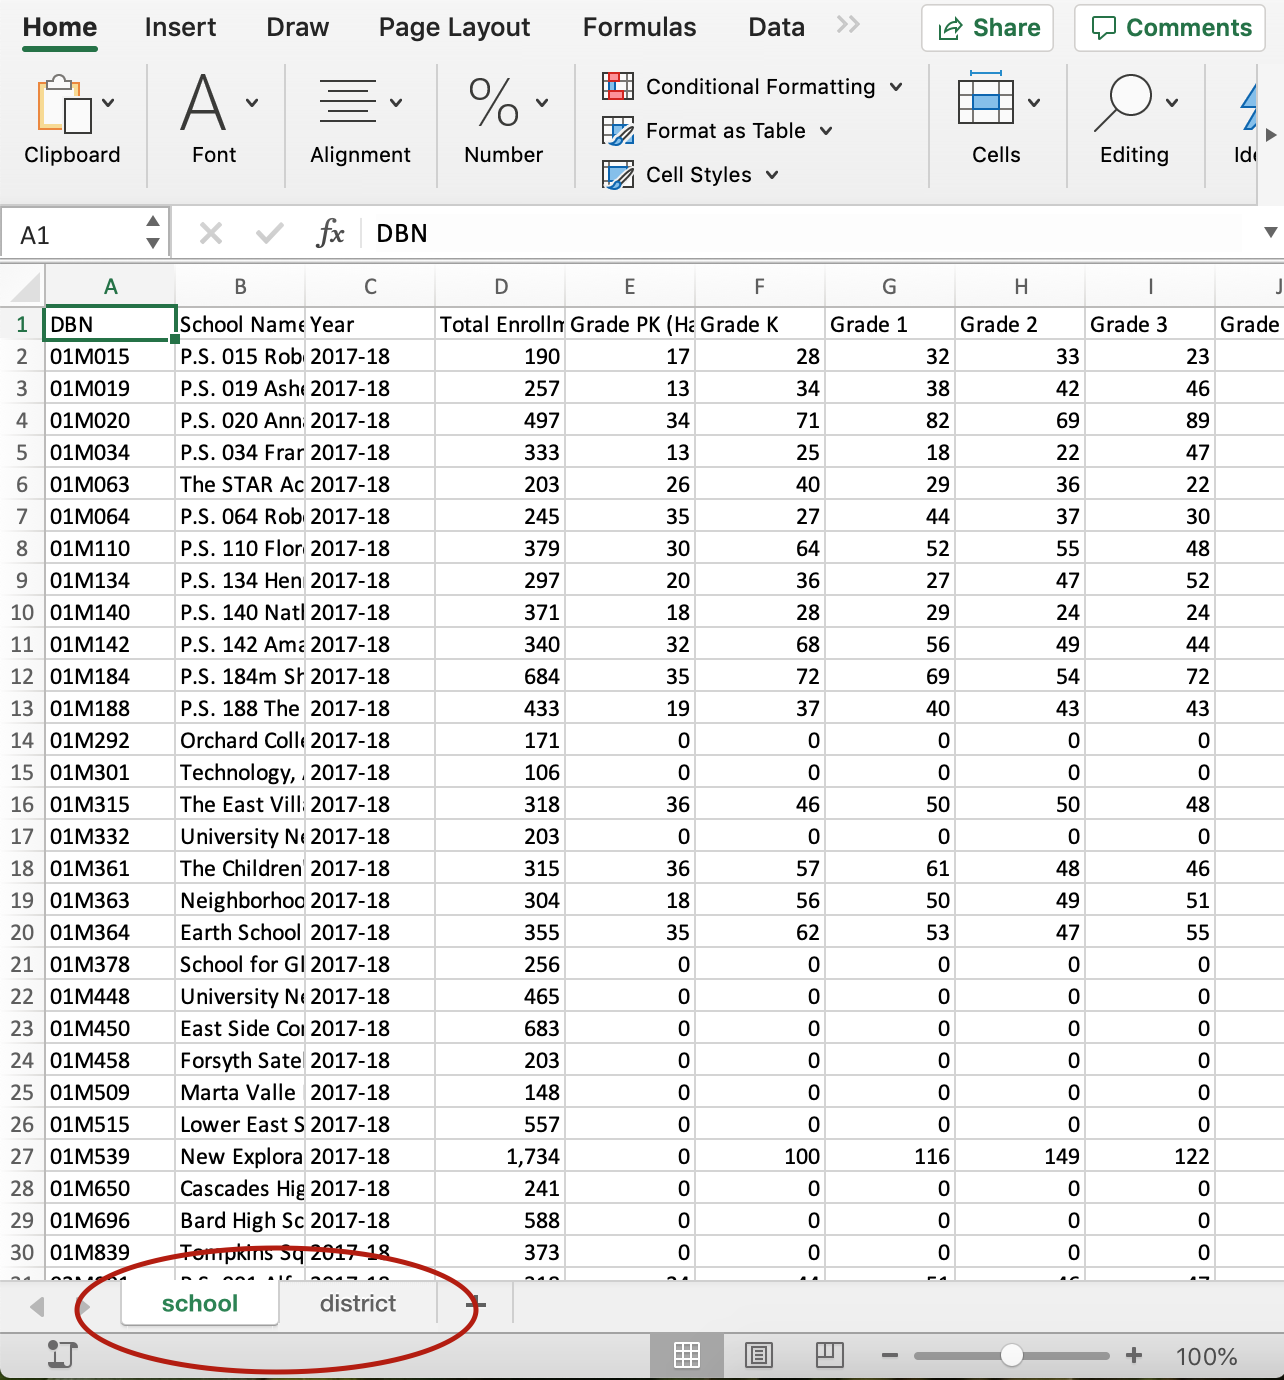
Parsing data into pieces
Merging data from different sources is easy to do when you have a common unique identifier…
Sometimes it Pays to Swap Axes
A simple solution for a vertical bar chart with long category labels is to swap the x and y axes so that the labels are shown on the y-axis, and the data are displayed along the x-axis…